|
As we have said goodbye to 2019 and to 2010s, let's review together the real estate market development over the recent years and over the past decade in Silicon Valley. Due to my MLS association, the market statistical data reported below are for Santa Clara County and San Mateo County only. Please contact me if you have any questions, or would like more information on your current market.
1. 2019 Median Sale Price
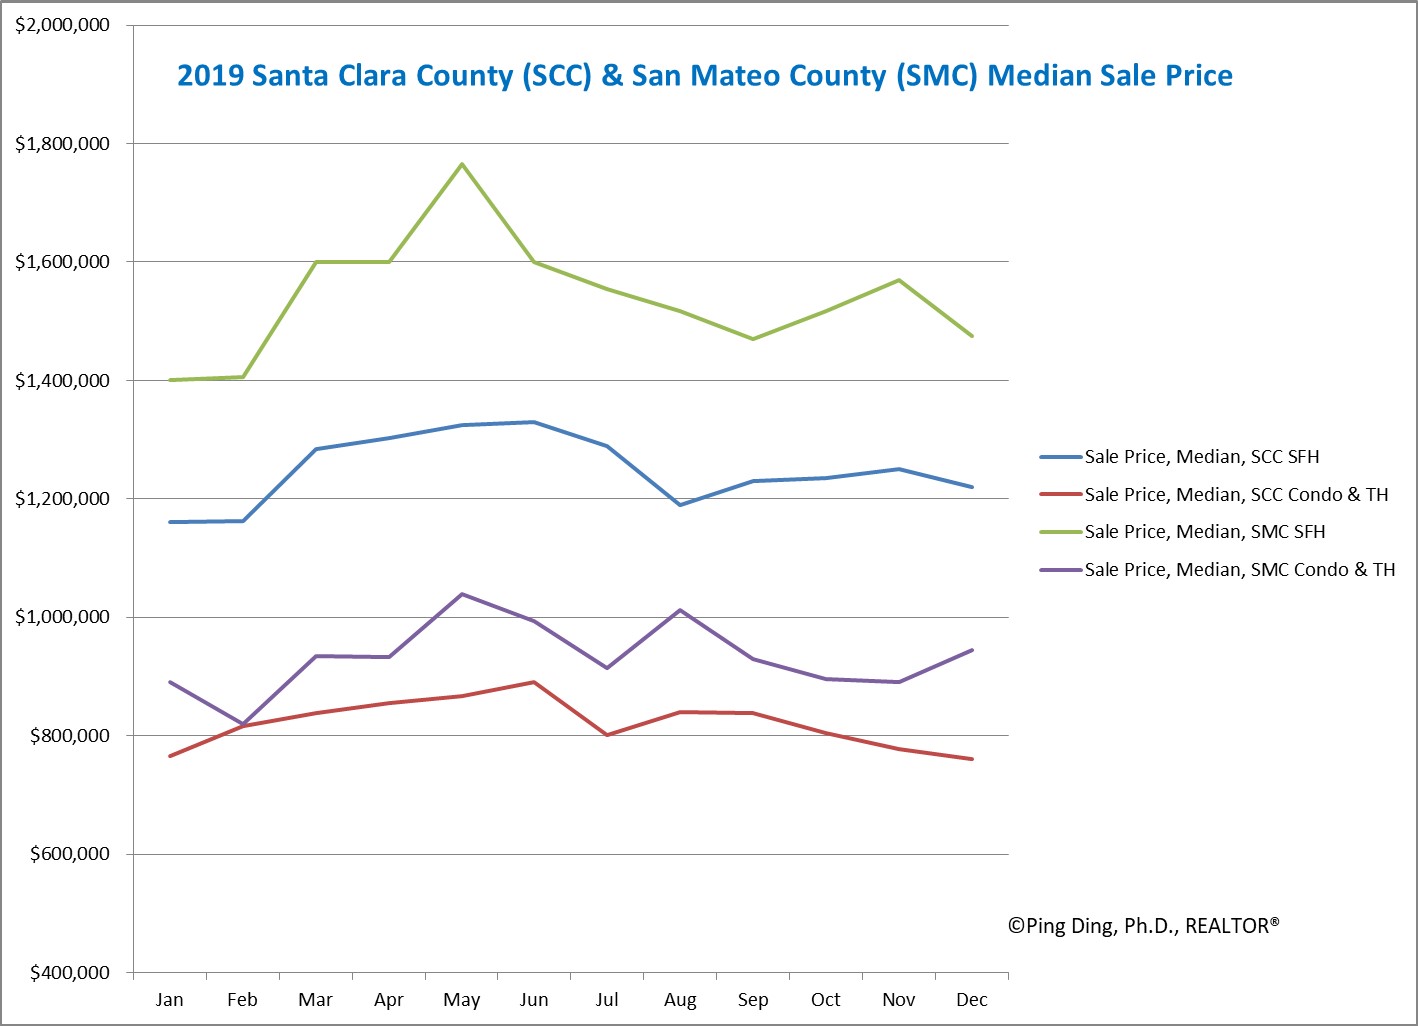
Chart Summary:
- All home types had the highest median sale price in May in San Mateo County and in June in Santa Clara County for the year. The Median Sale Price increased by ~15%-17% from January to the pre-summer peak time, except that single family homes in San Mateo County increased by as much as 26%!
- The year ended higher than the beginning of the year by 5-6%, except that condo & townhome type in Santa Clara County dipped back to the level of January.
- The December data here are for closed home sales in December and these homes mostly went in contract in November. County wise, the December's median sale price is a cut back from November's. However condos in San Mateo County have already seen a rebound.
- The bay area real estate market has seen an unseasonal warm-up in December, which will be reflected in the upcoming January's sale price.
2. 2017-2019 Median Sale Price Comparison by Zip Codes
Selected zip codes: 95014, 94087, 95132
Note: 95014 - Cupertino; 94087 - Southern Portion of Sunnyvale, bordering with Cupertino; 95132 - Part of San Jose Berryessa area. All data are normalized by each zip code's 3-year max.
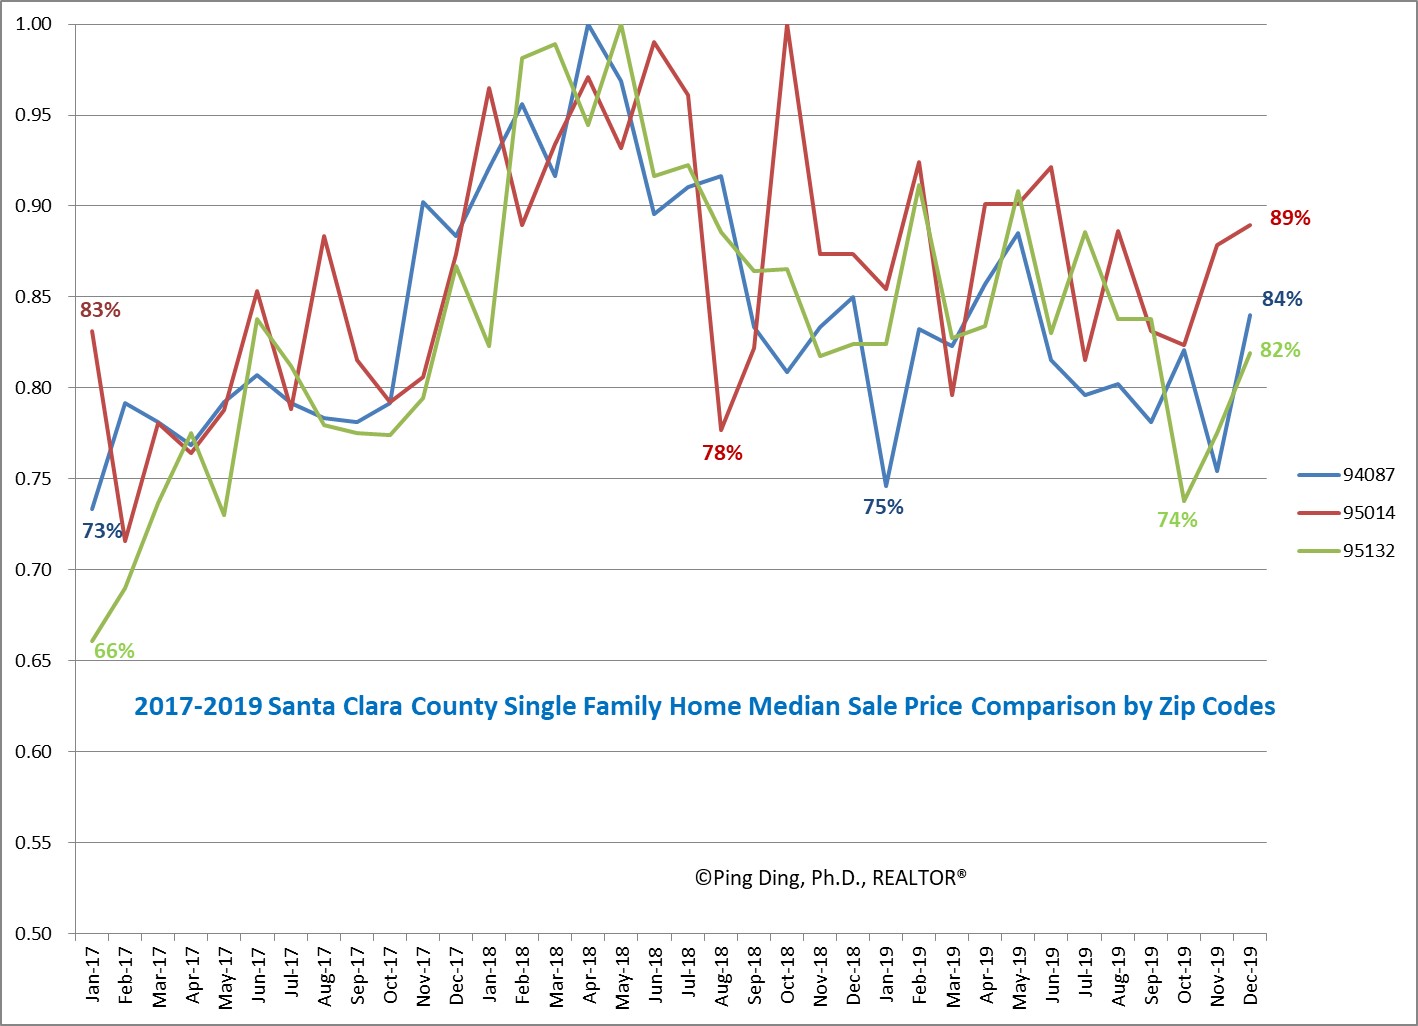
Chart Summary:
- Market peaked in spring 2018 during 2017-2019.
- Maximum pull back from its peak by zip code: 95014- 22%, 94087-25%, 95132-26%.
- 95014 demonstrated the best stability while 95132 showed the fastest growth in 2017.
- All these three zip codes have shown an up-trend toward the end of 2019.
3. 2010-2019 Normalized Median Sale Price
Note: Data are normalized by 12-month average of monthly median sale price of each category in 2010.
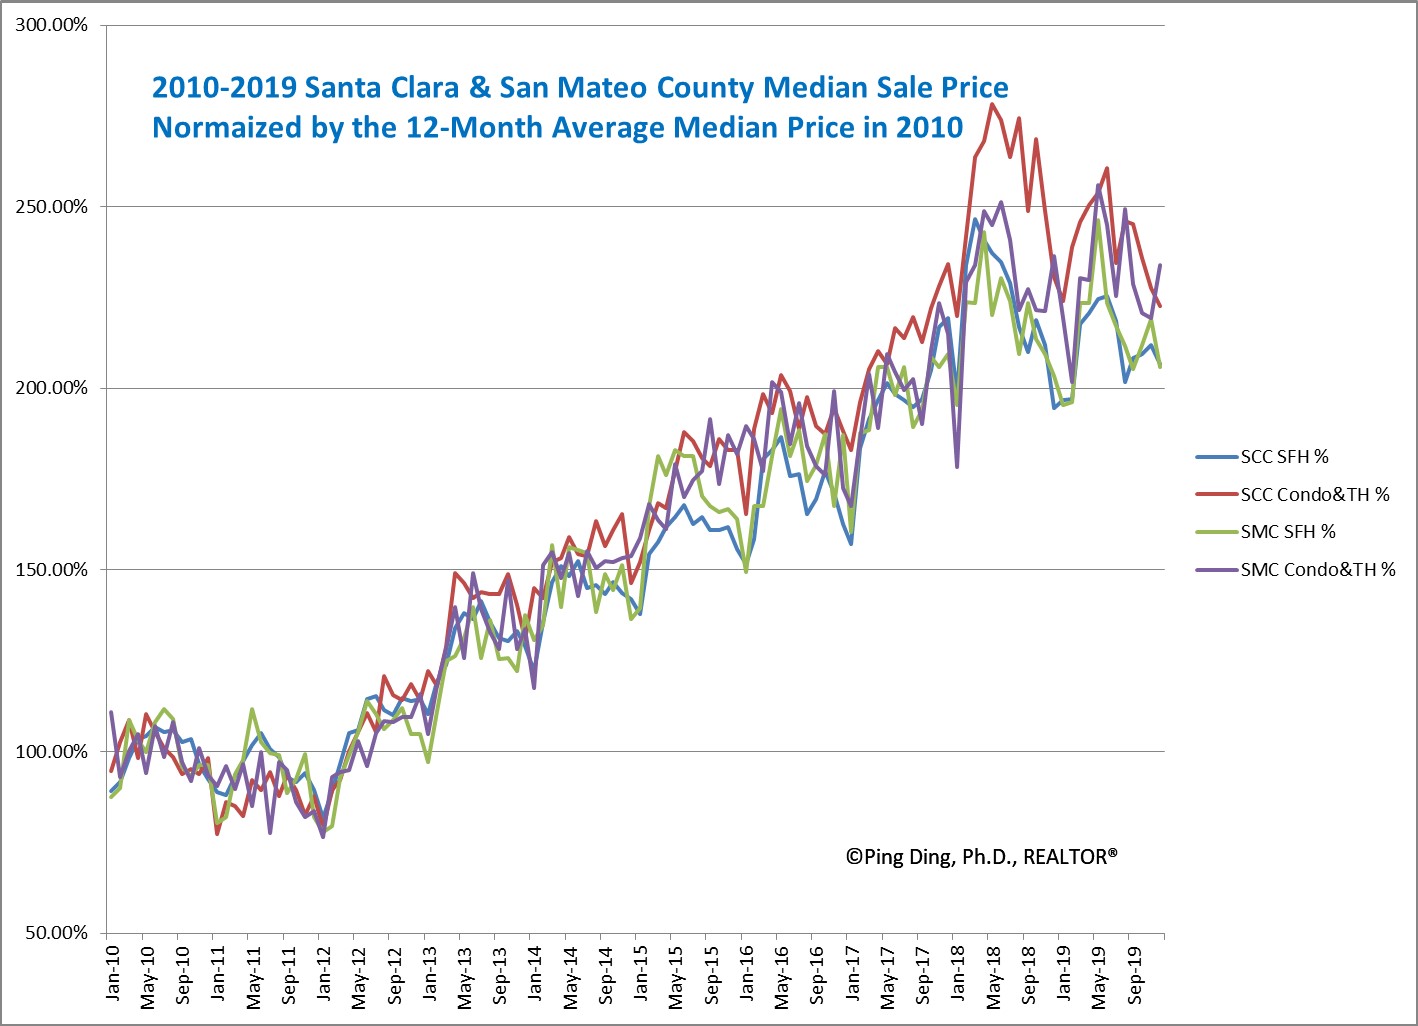
Chart Summary:
- Silicon Valley real estate market grew steadily since the beginning of 2012, after recovering from the 2008 financial crisis.
- Within each calendar year, homes sell highest in May or June and then the year concludes at a lower price from its annual high. However, Year 2017 is an exception to this pattern. The home value continued its growth in fall and ended higher in December than the pre-summer time.
- Median sale price has more than doubled over the past decade. It once almost reached or went over 250% (depending on property location or type), in spring 2018.
- Condos & Townhomes appreciated as much as single family homes did. In Santa Clara County, condos & townhomes even outformed single family homes.
This article is written by:
Ping Ding, Ph.D., REALTOR®
Cell: (408) 931-2168
微信号:: pingding88
DRE#: 01933073
ping.realtor@gmail.com
www.ping-realtor.com
Morgan Real Estate
|